Introduction
For clubs evaluating catchers and pitchers, framing and pitch-location comparisons across seasons must account for changes in what umpires call strikes. Public estimates of the 2026 shrink circulated within weeks (Clemens, FanGraphs, 28 April 2026). In 2025 the umpire grading buffer narrowed from two inches outside the edge to three-quarters of an inch either side (Andrews, FanGraphs, 5 May 2025); in 2026 regular-season ABS challenges began. The question is how much the zone changed at each step, against three old-rule seasons on one measurement plane; no published estimate I found gives both with intervals.
Methods
I re-projected 2022-2025 pitches to Statcast’s 2026 plate midpoint. The main height rule used roster height plus a fixed offset throughout. Sample, from Statcast and the MLB game feed: 1,830,231 called pitches in 12,060 regular-season games, 2022 through 21 September 2026. Near the edge, I fitted a binomial GAM to the umpire’s original, pre-challenge call by location and season, with umpire effects partially pooled. Each season’s zone is its 50 percent contour; model-conditional intervals (95% unless marked 90%) use 1,000 coefficient draws and omit season-to-season variation. With ABS-measured heights, the rebuilt geometry, not the fitted model, matched 10,164 of 10,168 ABS challenge verdicts. I measured both steps net of the 2022-2024 trend. The placebo pair, 2023 and 2024, had no change to the zone or umpire grading.
Results
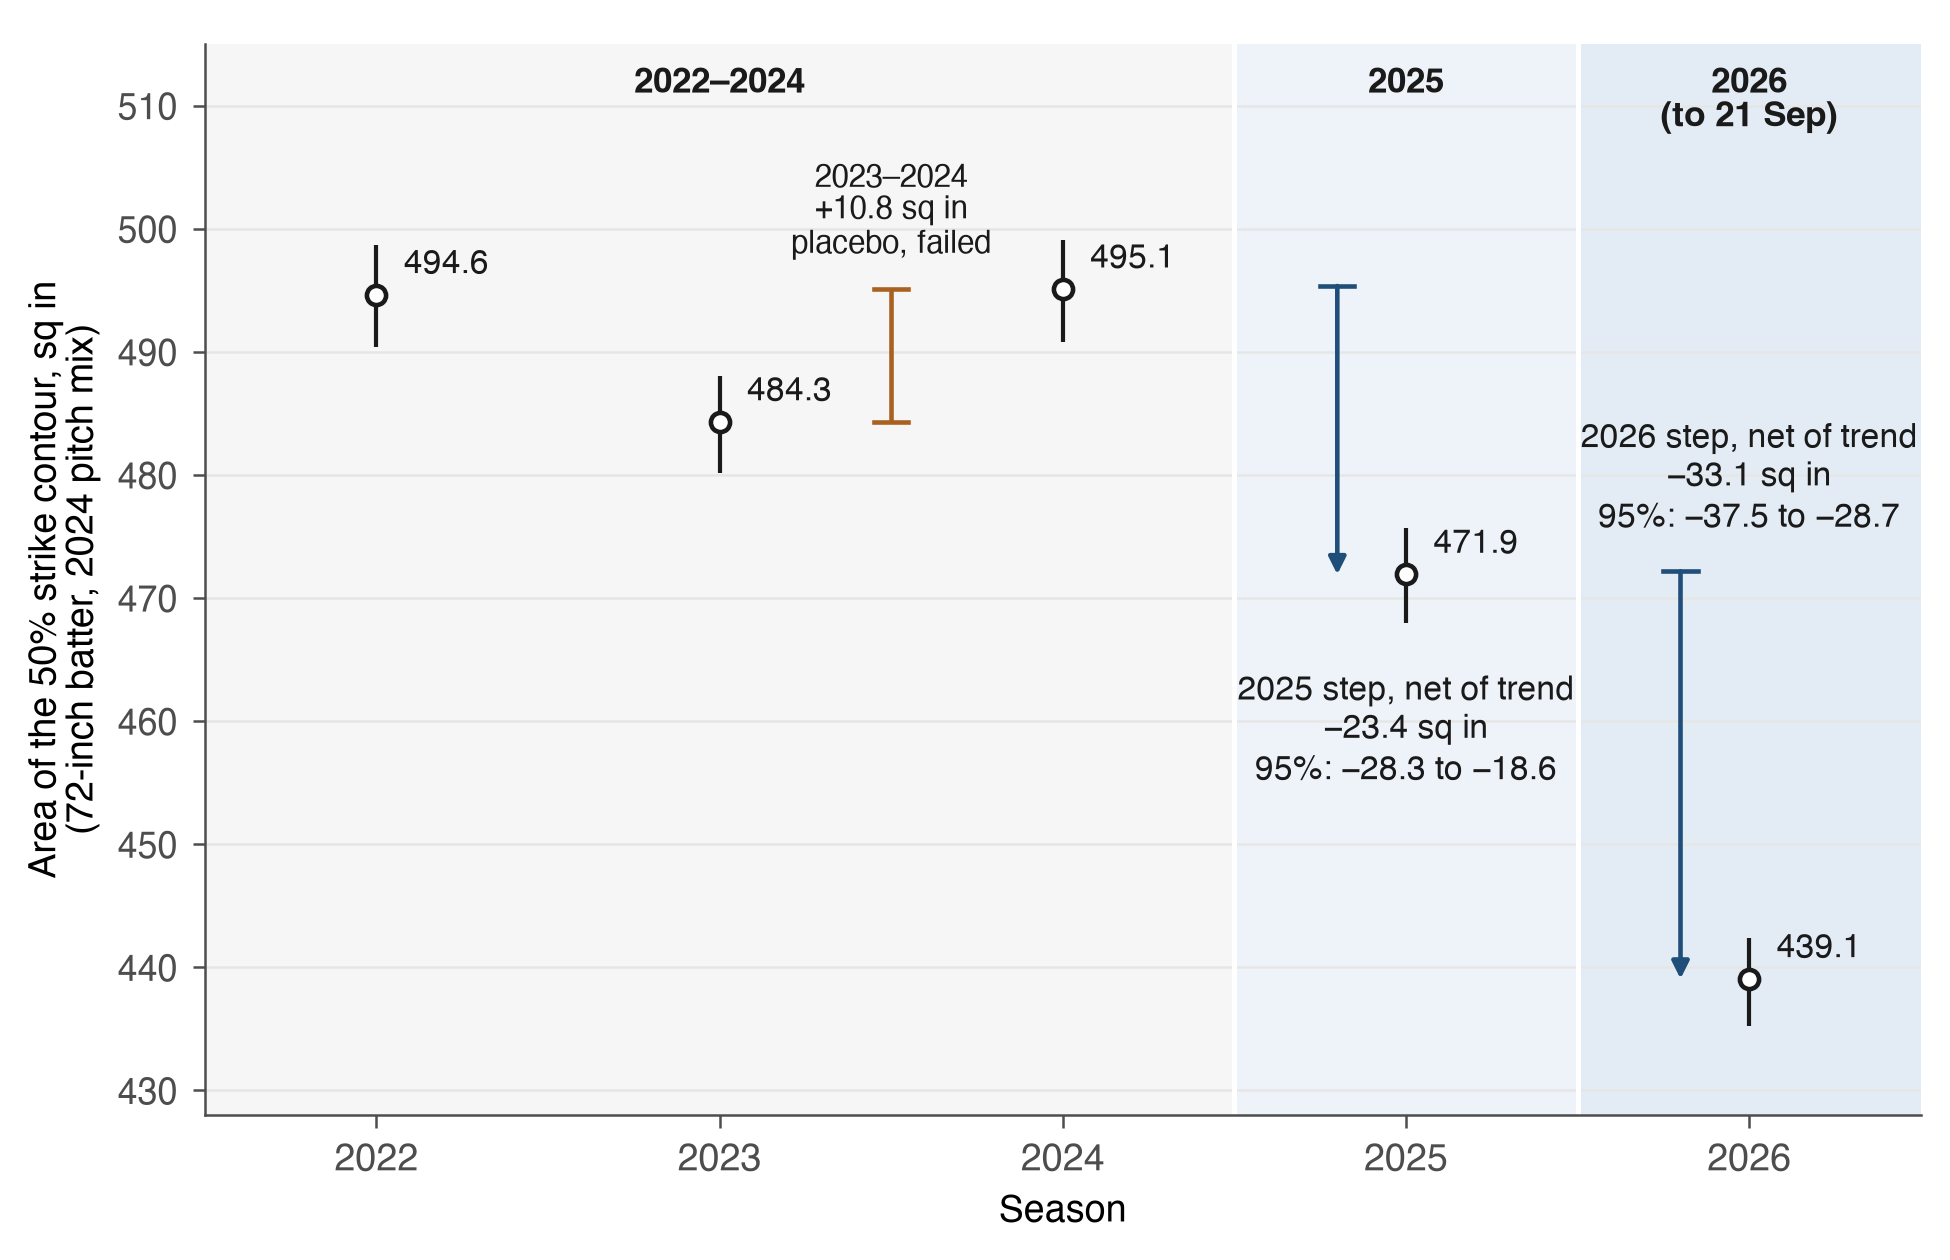
The pre-registered placebo failed: the zone grew 10.8 (90% CI 7.7 to 13.9) square inches, beyond its ±3 margin, so every step is descriptive. Net of the trend, the area fell 23.4 (95% CI 18.6 to 28.3) square inches in 2025 and 33.1 (95% CI 28.7 to 37.5) in 2026 (Figure 1). The zone lost width mostly in 2025 and height mostly in 2026 (Table 1). Within 3 inches of the rule-book zone’s edge, the called-strike rate fell 10.69 (95% CI 10.04 to 11.28) percentage points from 2024 to 2026. Clemens’s comparison reads 2025 at the plate front and 2026 at mid-plate. That convention gives a loss of 20.0 (95% CI 13.0 to 28.2) square inches; with both at mid-plate it is 32.8 (95% CI 29.3 to 36.6). The binned estimator failed the ±3 agreement tolerance, giving contractions of 29.5 and 40.7 square inches. Top-edge intervals covered 91 of 100 recovery runs, below the 93 bound.
![Table with six rows and five numeric columns: top edge and bottom edge and half-width in inches, area in square inches, and shadow-band strike rate in percentage points, each cell a point estimate with a 95 percent interval. Rows: the 2022-2024 trend per season (area 0.3 [-1.6, 2.2] sq in); the 2023-to-2024 change with the zone rules unchanged, the pre-registered placebo with a 90% interval, area 10.8 [7.7, 13.9] sq in against a margin of 3 and shadow-band rate 1.54 [1.03, 2.04] pp against 0.5, marked FAILED; the 2025 step net of trend, area -23.4 [-28.3, -18.6] sq in; the 2026 step net of trend, area -33.1 [-37.5, -28.7] sq in; the 2024-to-2026 total, area -56.0 [-59.6, -52.0] sq in; and, below a rule, the measurement-plane adjustment, not a period change, 2025 read at mid-plate minus at the front, area 12.9 [6.3, 19.2] sq in. The placebo row also carries edge cells added after the tag and not pre-registered, each with a 95 percent interval: top 0.47 [0.37, 0.57], bottom 0.16 [0.08, 0.24] and half-width 0.12 [0.06, 0.18] inches. A footnote states that no step is attributed to its rule, that top-edge intervals undercovered in the recovery test, and that the shadow band is the pitches within 3 inches either side of where the ball just touches the rule-book zone's edge. Its last lines, exploratory and not pre-registered, give the 2022-to-2023 area change, -10.3 [-13.4, -7.3] sq in at 90 percent, and the 2025 area step against the 2022-2024 mean plus one season of trend, -19.7 [-23.3, -16.1] sq in, and against 2023 alone, -12.4 [-15.8, -8.5] sq in.](/images/projects/abs-umpires/table1.png)
Conclusion
The 2025 zone was already smaller than any 2022-2024 zone, before regular-season challenges began, so framing and location baselines that start from 2025 miss that step. Table 1’s shifts serve three uses: season-adjusted framing and pitch-location baselines, edge targets for pitchers, and the plane correction for 2025-to-2026 Statcast comparisons. Main limit: the failed placebo; the design cannot assign either step to its rule. The sealed-set definition and acceptance criteria were committed publicly before the sealed set was opened. Games from 22 September 2026 on remain sealed for a confirmatory calibration check after the postseason.
The zone, the planes, the challenges
Drag, step and hover. Every number is also in a table.
Status
- Pre-registration: frozen at tag prereg-v1.
- Data through 2026-09-21.
- Sealed: regular-season games from 2026-09-22 and the postseason.
- Panel A: study data. Panel B: study data. Panel C: study data.
Strike zone explorer
STUDY DATA2022 to 2026, binned sharesLook at the gold line. It is where a taken pitch is called a strike half the time. The pale rectangle is the rule-book zone.
| Edge | 2022-2024 | 2025 | 2026 |
|---|---|---|---|
| Top | +2.52 in | +2.66 in | +2.32 in |
| Bottom | +2.78 in | +2.45 in | +1.71 in |
| Left | +2.37 in | +1.86 in | +1.56 in |
| Right | +2.95 in | +2.54 in | +2.19 in |
| Period | −14.00 in | −12.00 in | −10.00 in | −8.00 in | −6.00 in | −4.00 in | −2.00 in | 0.00 in | +2.00 in | +4.00 in | +6.00 in | +8.00 in | +10.00 in | +12.00 in | +14.00 in |
|---|---|---|---|---|---|---|---|---|---|---|---|---|---|---|---|
| 2022-2024 | 0.03 | 0.23 | 0.71 | 0.96 | 1.00 | 1.00 | 1.00 | 1.00 | 1.00 | 1.00 | 1.00 | 0.97 | 0.79 | 0.36 | 0.06 |
| 2025 | 0.01 | 0.12 | 0.61 | 0.94 | 1.00 | 1.00 | 1.00 | 1.00 | 1.00 | 1.00 | 1.00 | 0.95 | 0.71 | 0.28 | 0.04 |
| 2026 | 0.01 | 0.08 | 0.52 | 0.92 | 1.00 | 1.00 | 1.00 | 1.00 | 1.00 | 1.00 | 0.99 | 0.96 | 0.67 | 0.19 | 0.02 |
| Period | 10.00 in | 12.00 in | 14.00 in | 16.00 in | 18.00 in | 20.00 in | 22.00 in | 24.00 in | 26.00 in | 28.00 in | 30.00 in | 32.00 in | 34.00 in | 36.00 in | 38.00 in | 40.00 in | 42.00 in | 44.00 in | 46.00 in | 48.00 in | 50.00 in |
|---|---|---|---|---|---|---|---|---|---|---|---|---|---|---|---|---|---|---|---|---|---|
| 2022-2024 | 0.00 | 0.01 | 0.06 | 0.36 | 0.76 | 0.95 | 1.00 | 1.00 | 1.00 | 1.00 | 1.00 | 1.00 | 1.00 | 1.00 | 0.94 | 0.69 | 0.32 | 0.07 | 0.01 | 0.00 | 0.00 |
| 2025 | 0.00 | 0.00 | 0.05 | 0.25 | 0.71 | 0.92 | 1.00 | 1.00 | 1.00 | 1.00 | 1.00 | 1.00 | 1.00 | 0.99 | 0.96 | 0.74 | 0.34 | 0.09 | 0.00 | 0.00 | 0.00 |
| 2026 | 0.00 | 0.00 | 0.01 | 0.17 | 0.55 | 0.90 | 0.99 | 1.00 | 1.00 | 1.00 | 1.00 | 1.00 | 1.00 | 0.99 | 0.93 | 0.67 | 0.30 | 0.03 | 0.00 | 0.00 | 0.00 |
League surfaces are binned proportions of called strikes among called pitches. They are descriptive. They are not the fitted surfaces of the study.
Sample: the study's primary sample of called pitches, batter height from the roster plus the calibration offset.
Height is scaled to a reference batter of 72 in: z_ft = plate_z / batter height x reference height.
The 50 percent line is drawn on a count-weighted 3 by 3 smooth of the kept cells.
A cell is a 1 in location bin, and the floor is on the number of pitches in it: a cell under 30 called pitches is null in p and in n. The called strikes and balls inside a kept cell are not cells and are not floored: p times n gives them back, and that share is what the surface shows.
Each surface is the binned share for its own seasons. It does not hold the pitch mix fixed or remove the 2022-2024 trend, so its edges are not the study's fitted edges, and no difference between periods is printed from it. The study's fitted figures are in abs-umpires out/ch1/tab/T3_estimands.csv.
Periods present: 2022-2024, 2025, 2026.
Per-umpire surfaces are not published. The design cannot rank individual umpires reliably, and the pre-registration rules them out.
Surface
Keys 1 to 4 choose a view. Key 2 looks straight on from behind the plate, which is the view to read values from. Tab reaches the probe: arrow keys move it one cell, Enter pins it, Esc clears the pin, C switches the cut.
Drag to turn. Arrow keys turn the view when it has focus. T shows the table. R resets.
The share of called pitches that were called strikes, in cells of 1 in, at the middle of the plate, seen from behind the plate. Heights are scaled to a batter 72 in tall. Depth and colour show the same value, and 1.00 stands 8.5 in toward you. The gold line is the 50% contour. The pale rectangle is the rule-book zone. The line 1.45 in outside it is where the ball just touches the zone. Cells with fewer than 30 pitches are not drawn. These are binned shares, not the fitted surfaces of the study. Stepping between periods shows what changed and when, not why. The study’s pre-registered placebo failed: from 2023 to 2024, with no change to the zone or umpire grading, the zone still grew beyond its margin, so every step is descriptive.
A surface stands upright over home plate and is seen from behind the plate. Left to right is position across the plate in inches. Up is height, scaled to a batter 72 in tall. The surface comes toward the viewer where a called strike is more likely, by 8.5 in where the probability is 1.00. Colour repeats the same value, from dark blue at 0.00 to pale blue at 1.00. A gold line marks the 50% contour. A pale rectangle marks the rule-book zone, 17 in wide, from 27% to 53.5% of batter height. A control with three stops switches between 2022 to 2024, 2025 and 2026. The surface is the league surface of that period. A list chooses a second contour to draw beside it. Moving a probe over the surface reads the probability at that point and draws the profile of the surface through it.
Source: MLB Statcast via Baseball Savant and the MLB Stats API. Aggregates only.
Pitch flight and the two planes
STUDY DATA2022 to 2024, mean path per pitch typeLook at the two marks each pitch leaves, one on each plane. The mark on the gold middle plane is lower, and the gap is larger for the curveball than for the fastball.
| Pitch | Pitches | Speed (mph) | Approach angle (degrees) | Height at the front plane (in) | Height at the middle plane (in) | Difference (in) | Middle 90% of pitches (in) | Time between planes (ms) |
|---|---|---|---|---|---|---|---|---|
| Four-seam fastball | 353,890 | 94.0 | 4.8 | 33.87 | 33.15 | −0.71 | −1.00 to −0.42 | 5.6 |
| Sinker | 178,398 | 93.3 | 6.0 | 27.55 | 26.66 | −0.89 | −1.16 to −0.62 | 5.7 |
| Cutter | 84,428 | 89.2 | 6.4 | 28.10 | 27.14 | −0.95 | −1.31 to −0.62 | 5.9 |
| Changeup | 113,053 | 85.5 | 7.6 | 20.37 | 19.24 | −1.13 | −1.43 to −0.81 | 6.2 |
| Sweeper | 69,795 | 81.8 | 7.9 | 22.68 | 21.50 | −1.17 | −1.52 to −0.84 | 6.5 |
| Splitter | 23,275 | 86.7 | 7.9 | 18.69 | 17.51 | −1.18 | −1.50 to −0.83 | 6.1 |
| Slider | 168,425 | 85.4 | 7.9 | 21.14 | 19.96 | −1.18 | −1.52 to −0.82 | 6.2 |
| Slurve | 5,712 | 81.8 | 8.6 | 21.93 | 20.66 | −1.28 | −1.58 to −0.97 | 6.5 |
| Knuckle curve | 23,944 | 81.6 | 9.8 | 20.79 | 19.34 | −1.45 | −1.84 to −1.09 | 6.5 |
| Curveball | 83,132 | 78.9 | 9.9 | 22.13 | 20.65 | −1.48 | −1.89 to −1.10 | 6.8 |
- Each trajectory is the mean of the nine Statcast parameters over called pitches of that type, 2022-2024.
- crossing is computed from that mean trajectory. population.dz_mean_in is the mean of the per-pitch differences. The two differ slightly because the crossing time is not linear in the parameters.
- dz_in is the height at the middle plane minus the height at the front plane. Negative means lower at the middle.
- Pitch types with fewer than 2,000 called pitches are left out.
- Each group row pools the pitch types it lists, and only those.
- Re-projection against the warehouse's mid-plane height: largest gap 0.00e+00 ft on 1,105,459 pitches.
At the two planes
Height difference by pitch type
Drag to turn. Arrow keys turn the view when it has focus. T shows the table. R resets.
Each line is the mean path of one pitch type from release to the plate, at true scale. The paths are means over called pitches from 2022 to 2024. Left-handed pitchers are mirrored, so every path is a right-hander’s. Through 2025, Statcast reported where a pitch crossed the front of the plate. In 2026 it reports the middle of the plate, 8.5 in further on. A pitch is still falling there, so it crosses the middle plane lower, and a steeper pitch drops more. The study moves every pitch from 2022 to 2025 to the middle plane along its own path.
A scene shows home plate, 17 in wide, and the paths of two pitches from the release point to the plate at true scale. Two upright frames stand over the plate: the front plane at the front edge of the plate, and the middle plane 8.5 in behind it. Each path leaves a mark where it crosses each frame. Two small side views show the last 20 in of each path, with the ball drawn at its real radius of 1.45 in, and measure how much lower the pitch is at the middle plane than at the front plane. A chart gives the same difference for every pitch type in the file.
Source: MLB Statcast via Baseball Savant and the MLB Stats API. Aggregates only.
Challenges along the zone edge
STUDY DATA2026 regular season, through 2026-09-21, locations onlyLook at the gold line and at how the strips change as they move away from it. The gold line is the ABS boundary, where the ball just touches the zone.
| Distance from | Distance to | Top | Right | Bottom | Left |
|---|---|---|---|---|---|
| +3.00 in | +3.50 in | 50 | – | 42 | – |
| +2.50 in | +3.00 in | 60 | 45 | 57 | 33 |
| +2.00 in | +2.50 in | 102 | 77 | 114 | 66 |
| +1.50 in | +2.00 in | 144 | 153 | 190 | 119 |
| +1.00 in | +1.50 in | 157 | 217 | 291 | 164 |
| +0.50 in | +1.00 in | 185 | 274 | 382 | 259 |
| 0.00 in | +0.50 in | 157 | 304 | 435 | 345 |
| −0.50 in | 0.00 in | 180 | 324 | 458 | 391 |
| −1.00 in | −0.50 in | 190 | 285 | 399 | 342 |
| −1.50 in | −1.00 in | 145 | 242 | 342 | 295 |
| −2.00 in | −1.50 in | 103 | 149 | 273 | 235 |
| −2.50 in | −2.00 in | 84 | 107 | 196 | 147 |
| −3.00 in | −2.50 in | 44 | 65 | 130 | 89 |
| −3.50 in | −3.00 in | – | – | 61 | 41 |
| −4.00 in | −3.50 in | – | – | 31 | – |
- A dash means fewer than 30 pitches.
- A bin holds its lower limit and not its upper limit.
| Distance from | Distance to | Pitches |
|---|---|---|
| +3.50 in | +3.75 in | 40 |
| +3.25 in | +3.50 in | 55 |
| +3.00 in | +3.25 in | 83 |
| +2.75 in | +3.00 in | 91 |
| +2.50 in | +2.75 in | 104 |
| +2.25 in | +2.50 in | 149 |
| +2.00 in | +2.25 in | 210 |
| +1.75 in | +2.00 in | 287 |
| +1.50 in | +1.75 in | 319 |
| +1.25 in | +1.50 in | 397 |
| +1.00 in | +1.25 in | 432 |
| +0.75 in | +1.00 in | 532 |
| +0.50 in | +0.75 in | 568 |
| +0.25 in | +0.50 in | 600 |
| 0.00 in | +0.25 in | 641 |
| −0.25 in | 0.00 in | 637 |
| −0.50 in | −0.25 in | 716 |
| −0.75 in | −0.50 in | 635 |
| −1.00 in | −0.75 in | 581 |
| −1.25 in | −1.00 in | 532 |
| −1.50 in | −1.25 in | 492 |
| −1.75 in | −1.50 in | 401 |
| −2.00 in | −1.75 in | 359 |
| −2.25 in | −2.00 in | 284 |
| −2.50 in | −2.25 in | 250 |
| −2.75 in | −2.50 in | 186 |
| −3.00 in | −2.75 in | 142 |
| −3.25 in | −3.00 in | 85 |
| −3.50 in | −3.25 in | 71 |
| −3.75 in | −3.50 in | 60 |
| −4.00 in | −3.75 in | 34 |
| −4.25 in | −4.00 in | 32 |
- Bins with fewer than 30 pitches are left out.
| Across from | Across to | Height from | Height to | Pitches |
|---|---|---|---|---|
| −1.20 | −1.00 | +1.20 | +1.40 | 30 |
| −1.00 | −0.80 | +1.20 | +1.40 | 52 |
| −0.80 | −0.60 | +1.20 | +1.40 | 78 |
| −0.60 | −0.40 | +1.20 | +1.40 | 55 |
| −0.40 | −0.20 | +1.20 | +1.40 | 48 |
| −0.20 | 0.00 | +1.20 | +1.40 | 51 |
| 0.00 | +0.20 | +1.20 | +1.40 | 50 |
| +0.40 | +0.60 | +1.20 | +1.40 | 37 |
| +0.60 | +0.80 | +1.20 | +1.40 | 52 |
| +0.80 | +1.00 | +1.20 | +1.40 | 47 |
| −1.20 | −1.00 | +1.00 | +1.20 | 59 |
| −1.00 | −0.80 | +1.00 | +1.20 | 78 |
| −0.80 | −0.60 | +1.00 | +1.20 | 91 |
| −0.60 | −0.40 | +1.00 | +1.20 | 70 |
| −0.40 | −0.20 | +1.00 | +1.20 | 58 |
| −0.20 | 0.00 | +1.00 | +1.20 | 40 |
| 0.00 | +0.20 | +1.00 | +1.20 | 51 |
| +0.20 | +0.40 | +1.00 | +1.20 | 45 |
| +0.40 | +0.60 | +1.00 | +1.20 | 48 |
| +0.60 | +0.80 | +1.00 | +1.20 | 66 |
| +0.80 | +1.00 | +1.00 | +1.20 | 58 |
| +1.00 | +1.20 | +1.00 | +1.20 | 47 |
| −1.40 | −1.20 | +0.80 | +1.00 | 33 |
| −1.20 | −1.00 | +0.80 | +1.00 | 107 |
| −1.00 | −0.80 | +0.80 | +1.00 | 84 |
| −0.80 | −0.60 | +0.80 | +1.00 | 51 |
| +0.40 | +0.60 | +0.80 | +1.00 | 30 |
| +0.60 | +0.80 | +0.80 | +1.00 | 40 |
| +0.80 | +1.00 | +0.80 | +1.00 | 53 |
| +1.00 | +1.20 | +0.80 | +1.00 | 67 |
| +1.20 | +1.40 | +0.80 | +1.00 | 31 |
| −1.40 | −1.20 | +0.60 | +0.80 | 53 |
| −1.20 | −1.00 | +0.60 | +0.80 | 125 |
| −1.00 | −0.80 | +0.60 | +0.80 | 71 |
| +0.80 | +1.00 | +0.60 | +0.80 | 37 |
| +1.00 | +1.20 | +0.60 | +0.80 | 77 |
| +1.20 | +1.40 | +0.60 | +0.80 | 52 |
| −1.40 | −1.20 | +0.40 | +0.60 | 60 |
| −1.20 | −1.00 | +0.40 | +0.60 | 103 |
| −1.00 | −0.80 | +0.40 | +0.60 | 60 |
| +1.00 | +1.20 | +0.40 | +0.60 | 83 |
| +1.20 | +1.40 | +0.40 | +0.60 | 63 |
| −1.40 | −1.20 | +0.20 | +0.40 | 64 |
| −1.20 | −1.00 | +0.20 | +0.40 | 105 |
| −1.00 | −0.80 | +0.20 | +0.40 | 42 |
| +1.00 | +1.20 | +0.20 | +0.40 | 60 |
| +1.20 | +1.40 | +0.20 | +0.40 | 68 |
| −1.40 | −1.20 | 0.00 | +0.20 | 63 |
| −1.20 | −1.00 | 0.00 | +0.20 | 89 |
| −1.00 | −0.80 | 0.00 | +0.20 | 52 |
| +1.00 | +1.20 | 0.00 | +0.20 | 68 |
| +1.20 | +1.40 | 0.00 | +0.20 | 87 |
| −1.40 | −1.20 | −0.20 | 0.00 | 80 |
| −1.20 | −1.00 | −0.20 | 0.00 | 97 |
| −1.00 | −0.80 | −0.20 | 0.00 | 49 |
| +1.00 | +1.20 | −0.20 | 0.00 | 86 |
| +1.20 | +1.40 | −0.20 | 0.00 | 78 |
| −1.40 | −1.20 | −0.40 | −0.20 | 73 |
| −1.20 | −1.00 | −0.40 | −0.20 | 107 |
| −1.00 | −0.80 | −0.40 | −0.20 | 38 |
| +0.80 | +1.00 | −0.40 | −0.20 | 30 |
| +1.00 | +1.20 | −0.40 | −0.20 | 95 |
| +1.20 | +1.40 | −0.40 | −0.20 | 85 |
| −1.40 | −1.20 | −0.60 | −0.40 | 77 |
| −1.20 | −1.00 | −0.60 | −0.40 | 112 |
| −1.00 | −0.80 | −0.60 | −0.40 | 41 |
| +0.80 | +1.00 | −0.60 | −0.40 | 42 |
| +1.00 | +1.20 | −0.60 | −0.40 | 95 |
| +1.20 | +1.40 | −0.60 | −0.40 | 73 |
| −1.40 | −1.20 | −0.80 | −0.60 | 79 |
| −1.20 | −1.00 | −0.80 | −0.60 | 121 |
| −1.00 | −0.80 | −0.80 | −0.60 | 71 |
| +0.80 | +1.00 | −0.80 | −0.60 | 55 |
| +1.00 | +1.20 | −0.80 | −0.60 | 145 |
| +1.20 | +1.40 | −0.80 | −0.60 | 98 |
| −1.40 | −1.20 | −1.00 | −0.80 | 54 |
| −1.20 | −1.00 | −1.00 | −0.80 | 149 |
| −1.00 | −0.80 | −1.00 | −0.80 | 100 |
| −0.80 | −0.60 | −1.00 | −0.80 | 83 |
| −0.60 | −0.40 | −1.00 | −0.80 | 59 |
| −0.40 | −0.20 | −1.00 | −0.80 | 76 |
| −0.20 | 0.00 | −1.00 | −0.80 | 69 |
| 0.00 | +0.20 | −1.00 | −0.80 | 48 |
| +0.20 | +0.40 | −1.00 | −0.80 | 63 |
| +0.40 | +0.60 | −1.00 | −0.80 | 66 |
| +0.60 | +0.80 | −1.00 | −0.80 | 101 |
| +0.80 | +1.00 | −1.00 | −0.80 | 127 |
| +1.00 | +1.20 | −1.00 | −0.80 | 149 |
| +1.20 | +1.40 | −1.00 | −0.80 | 83 |
| −1.40 | −1.20 | −1.20 | −1.00 | 30 |
| −1.20 | −1.00 | −1.20 | −1.00 | 99 |
| −1.00 | −0.80 | −1.20 | −1.00 | 129 |
| −0.80 | −0.60 | −1.20 | −1.00 | 157 |
| −0.60 | −0.40 | −1.20 | −1.00 | 149 |
| −0.40 | −0.20 | −1.20 | −1.00 | 144 |
| −0.20 | 0.00 | −1.20 | −1.00 | 147 |
| 0.00 | +0.20 | −1.20 | −1.00 | 142 |
| +0.20 | +0.40 | −1.20 | −1.00 | 142 |
| +0.40 | +0.60 | −1.20 | −1.00 | 178 |
| +0.60 | +0.80 | −1.20 | −1.00 | 145 |
| +0.80 | +1.00 | −1.20 | −1.00 | 151 |
| +1.00 | +1.20 | −1.20 | −1.00 | 99 |
| +1.20 | +1.40 | −1.20 | −1.00 | 42 |
| −1.20 | −1.00 | −1.40 | −1.20 | 39 |
| −1.00 | −0.80 | −1.40 | −1.20 | 59 |
| −0.80 | −0.60 | −1.40 | −1.20 | 85 |
| −0.60 | −0.40 | −1.40 | −1.20 | 99 |
| −0.40 | −0.20 | −1.40 | −1.20 | 93 |
| −0.20 | 0.00 | −1.40 | −1.20 | 106 |
| 0.00 | +0.20 | −1.40 | −1.20 | 87 |
| +0.20 | +0.40 | −1.40 | −1.20 | 95 |
| +0.40 | +0.60 | −1.40 | −1.20 | 114 |
| +0.60 | +0.80 | −1.40 | −1.20 | 75 |
| +0.80 | +1.00 | −1.40 | −1.20 | 67 |
| +1.00 | +1.20 | −1.40 | −1.20 | 34 |
- Across: plate_x / half plate width; the plate edges are -1 and +1.
- Height: (plate_z - zone centre) / half zone height; the zone bottom and top are -1 and +1.
- Cells with fewer than 30 pitches are left out.
| Pitches compared | Pitches | Same verdict as ABS | Percent |
|---|---|---|---|
| All challenged pitches | 10,168 | 10,164 | 99.96% |
| Outside the half-inch band | 7,574 | 7,573 | 99.99% |
| Inside the half-inch band | 2,594 | 2,591 | 99.88% |
| Top edge | 1,707 | 1,707 | 100.00% |
| Side edges | 4,980 | 4,979 | 99.98% |
| Bottom edge | 3,481 | 3,478 | 99.91% |
- The band is 0.50 in either side of the ABS boundary.
- Locations, and one outcome: the share of challenges overturned in each half-inch bin of distance from the ABS boundary, either side. The umpire's original call is not in this file.
- 5,490 of the 10,168 regular-season challenges of 2026 through 2026-09-21 were overturned. The overturn bins run from 0 to 5 in; challenges further out are not in them.
- An overturn bin is null when its count, less the distance bins it covers, would give back a distance bin left out under the floor.
- A cell or bin is a location bin, and the floor is on the number of challenged pitches in it. The overturned and upheld counts inside a published bin are not cells and are not floored: a rate times its bin's count gives them back, and every published bin carries its rate. overturn.n_overturned counts every overturned challenge, at any distance.
- The overturn shares are descriptive counts. They hold nothing else fixed.
- The zone is the one ABS scored: 53.5% and 27% of the measured batter height, at the middle of the plate.
- zone.half_height_ft and zone.centre_z_ft are means over the challenged pitches, for drawing in feet.
- Cells and bins under 30 pitches are null.
- The agreement rows are published results of the study, traced to out/ch1/tab/T2_zone_gate.csv. Agree and disagree are outcome counts inside a row, not cells, so the floor does not apply: n less n_agree is the count of disagreements in each row.
- Distance: inches from the ABS strike boundary, ball radius taken off; negative is a strike by ABS.
Zone check
10,164 of 10,168
99.96% of all challenged pitches
The zone rebuilt from each batter’s measured height gave the same in-or-out verdict as ABS on these challenged pitches.
Traced to abs-umpires: out/ch1/tab/T2_zone_gate.csv, receipt W3.8
| Pitches compared | Same verdict as ABS | Percent |
|---|---|---|
| Outside the half-inch band | 7,573 of 7,574 | 99.99% |
| Inside the half-inch band | 2,591 of 2,594 | 99.88% |
| Top edge | 1,707 of 1,707 | 100.00% |
| Side edges | 4,979 of 4,980 | 99.98% |
| Bottom edge | 3,478 of 3,481 | 99.91% |
Arrow keys move between strips when the view has focus. T shows the table. R resets.
Each strip counts the regular-season challenged pitches of 2026 at one distance from the ABS boundary, in half-inch steps, for one edge of the zone. The data runs through 2026-09-21. The distance has the ball radius taken off, so 0.00 in means the ball just touches the zone and a negative distance is a strike by ABS. Unrolled, the four edges share one distance axis. Strips with fewer than 30 pitches are not drawn. The strips show where challenged pitches were. They do not show the umpire’s call or whether a challenge was overturned.
A drawing of the strike zone from the catcher’s view, with bands around its four edges. Each band covers half an inch of distance from the ABS boundary, the line where the ball just touches the zone. A band is brighter where more challenged pitches fell. A switch straightens the four edges into four columns that share one distance axis, with distance outside the zone upward. Two handles set a range of distance, and the panel counts the challenged pitches inside it.
Source: MLB Statcast via Baseball Savant and the MLB Stats API. Aggregates only.
Final paper coming December 2026.